Research Demonstrates the Effectiveness of Context Analytics' News Sentiment Data in Constructing Sector-Based Indices and Portfolio Strategies
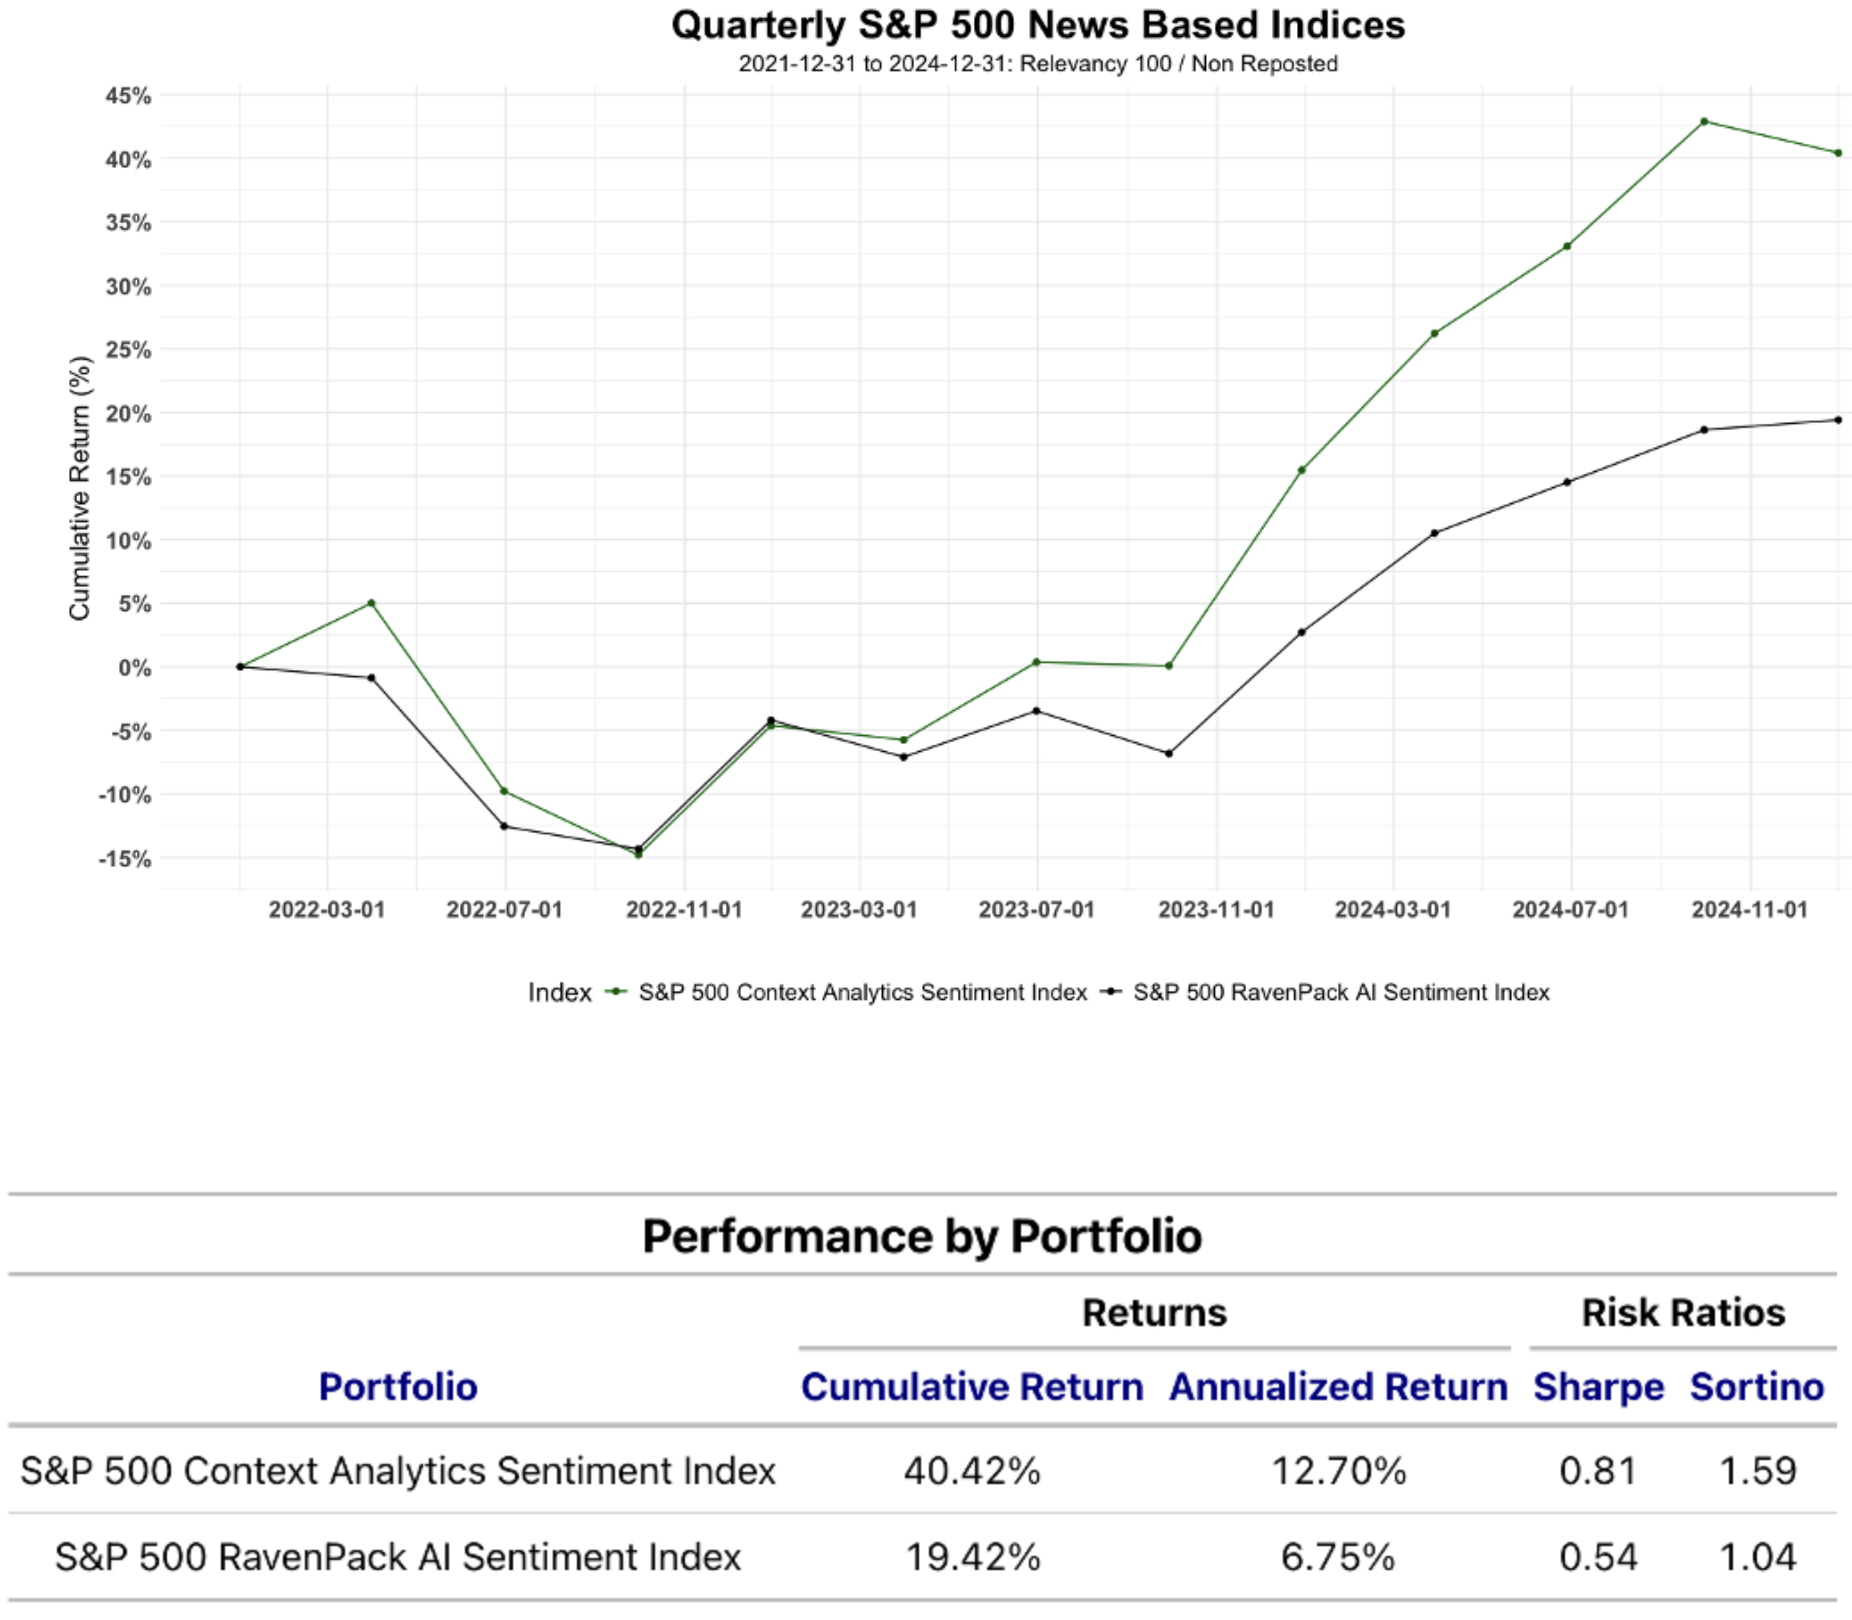
CHICAGO, ILLINOIS / ACCESS Newswire / January 23, 2025 / Context Analytics (CA) has developed a proprietary news sentiment data feed to construct a sentiment-driven, sector-based index. This index was compared to the S&P 500 RavenPack AI Sentiment Index (CSRPAISE) to evaluate the effectiveness of CA's sentiment data as a long-term predictor of market performance.
Returns & metrics for both are calculated by Context Analytics.
Methodological Differences:
News Data Sources:
CSRPAISE: Utilizes RavenPack's Average Event Sentiment Score (ESS), which is market cap-weighted within sectors before aggregation.
CA Index: Employs CA's proprietary sentiment scores, applying equal weighting within sector summations. This approach reduces the influence of large-cap stocks, emphasizing actual sentiment over market capitalization.
Sector Weighting:
CSRPAISE: Applies market cap weighting within sectors and incorporates a risk-adjusted weighting, where sectors are weighted inversely proportional to their estimated volatility.
CA Index: Equally weights the four selected sectors, relying primarily on sentiment for selections without incorporating risk adjustments.
Data and Methodology:
Data Sources:
News Sentiment Data: CA's proprietary financial news sentiment data, filtered to include only non-reposted articles with 100% relevancy, each uniquely discussing a specific S&P 500 constituent.
Market Data: Market capitalizations for S&P 500 constituents and GIC sector indices.
Sentiment Score Calculation:
Daily Aggregation: For each S&P 500 ticker, daily counts of positive sentiment words and total sentiment words in articles were calculated.
Monthly Aggregation: Daily counts were aggregated at the end of each month.
Quarterly Weighted Sum: A 3x exponential weighting scheme was applied over the previous quarter, emphasizing recent sentiment trends.
Positivity Ratio: Calculated as the ratio of positive sentiment words to total sentiment words for each stock.
Sector Sentiment Calculation: Sector sentiment scores were derived by summing the positivity ratios across all stocks within each sector and dividing by the number of stocks in the sector.
Conclusion:
The study aimed to assess the performance of CA's news sentiment data as a long-term predictor of market performance, using a methodology comparable to the benchmark CSRPAISE index. The findings suggest that CA's sentiment-driven index, with its unique weighting and data aggregation methods, offers a distinct approach to market sentiment analysis. Further research is recommended to fully understand the implications of these methodological differences on market prediction accuracy.
For more detailed information, please refer to the full paper: CA Sentiment Data vs. S&P 500 RavenPack AI Sentiment Index
Contact Information
Madison Wray
Business Development Analyst
madison@contextanalytics-ai.com
(312) 788-2607
SOURCE: Context Analytics Inc.
View the original press release on ACCESS Newswire


