
Building products installation services company Installed Building Products (NYSE:IBP) met Wall Street’s revenue expectations in Q3 CY2024, with sales up 7.7% year on year to $760.6 million. Its non-GAAP profit of $2.85 per share was 4.4% below analysts’ consensus estimates.
Is now the time to buy Installed Building Products? Find out by accessing our full research report, it’s free.
Installed Building Products (IBP) Q3 CY2024 Highlights:
- Revenue: $760.6 million vs analyst estimates of $757.2 million (in line)
- Adjusted EPS: $2.85 vs analyst expectations of $2.98 (4.4% miss)
- EBITDA: $132.3 million vs analyst estimates of $136.8 million (3.3% miss)
- Gross Margin (GAAP): 33.8%, in line with the same quarter last year
- Operating Margin: 13.3%, down from 14.5% in the same quarter last year
- EBITDA Margin: 17.4%, down from 18.5% in the same quarter last year
- Free Cash Flow Margin: 10.2%, down from 13.3% in the same quarter last year
- Market Capitalization: $6.39 billion
“IBP delivered record third-quarter revenue and profitability, with each end market, from residential to commercial, growing organically. Our talented and committed employees across the country focused on what they can control by providing our customers with reliable, high-quality building product installation service. The long-term view on demand for our installed service is unchanged. We believe residential and commercial end market trends are favorable as builders work to meet demand through the increased supply of houses, apartments, and commercial structures,” stated Jeff Edwards, Chairman and Chief Executive Officer.
Company Overview
Founded in 1977, Installed Building Products (NYSE:IBP) is a company specializing in the installation of insulation, waterproofing, and other complementary building products for residential and commercial construction.
Home Builders
Traditionally, homebuilders have built competitive advantages with economies of scale that lead to advantaged purchasing and brand recognition among consumers. Aesthetic trends have always been important in the space, but more recently, energy efficiency and conservation are driving innovation. However, these companies are still at the whim of the macro, specifically interest rates that heavily impact new and existing home sales. In fact, homebuilders are one of the most cyclical subsectors within industrials.
Sales Growth
A company’s long-term performance can indicate its business quality. Any business can put up a good quarter or two, but many enduring ones grow for years. Thankfully, Installed Building Products’s 14.7% annualized revenue growth over the last five years was exceptional. This is a great starting point for our analysis because it shows Installed Building Products’s offerings resonate with customers.
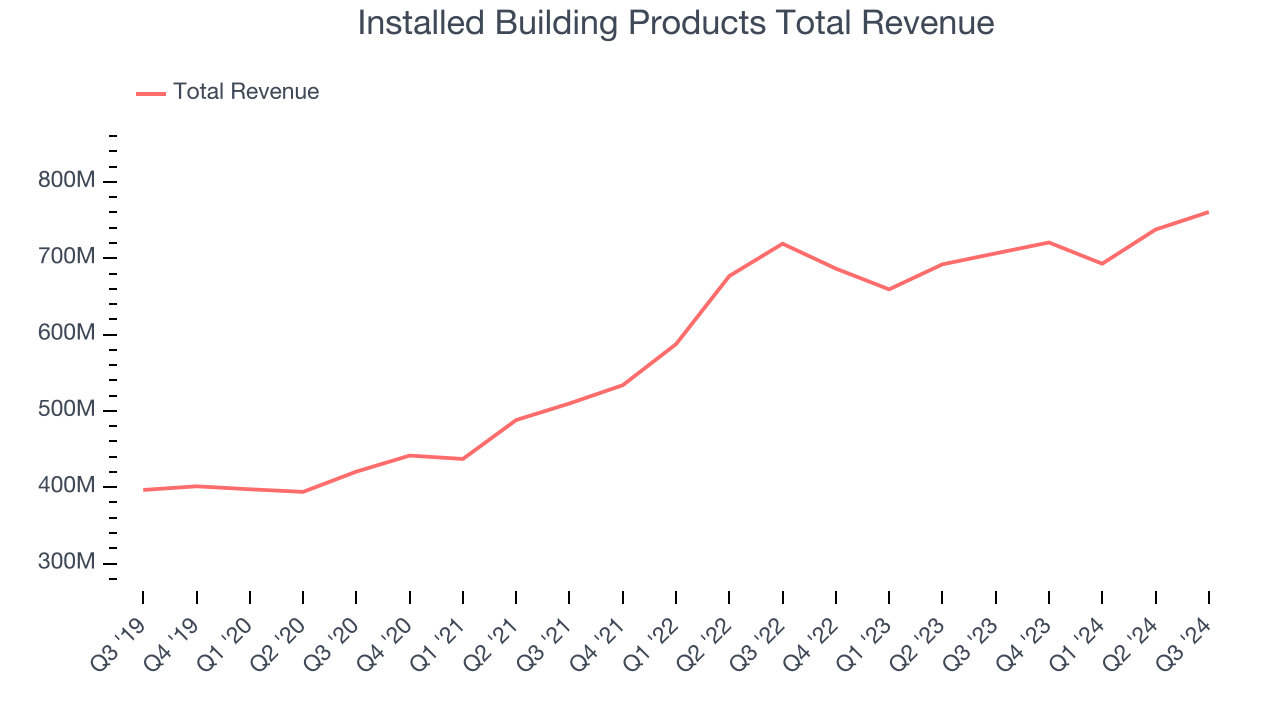
We at StockStory place the most emphasis on long-term growth, but within industrials, a half-decade historical view may miss cycles, industry trends, or a company capitalizing on catalysts such as a new contract win or a successful product line. Installed Building Products’s annualized revenue growth of 7.6% over the last two years is below its five-year trend, but we still think the results were respectable. 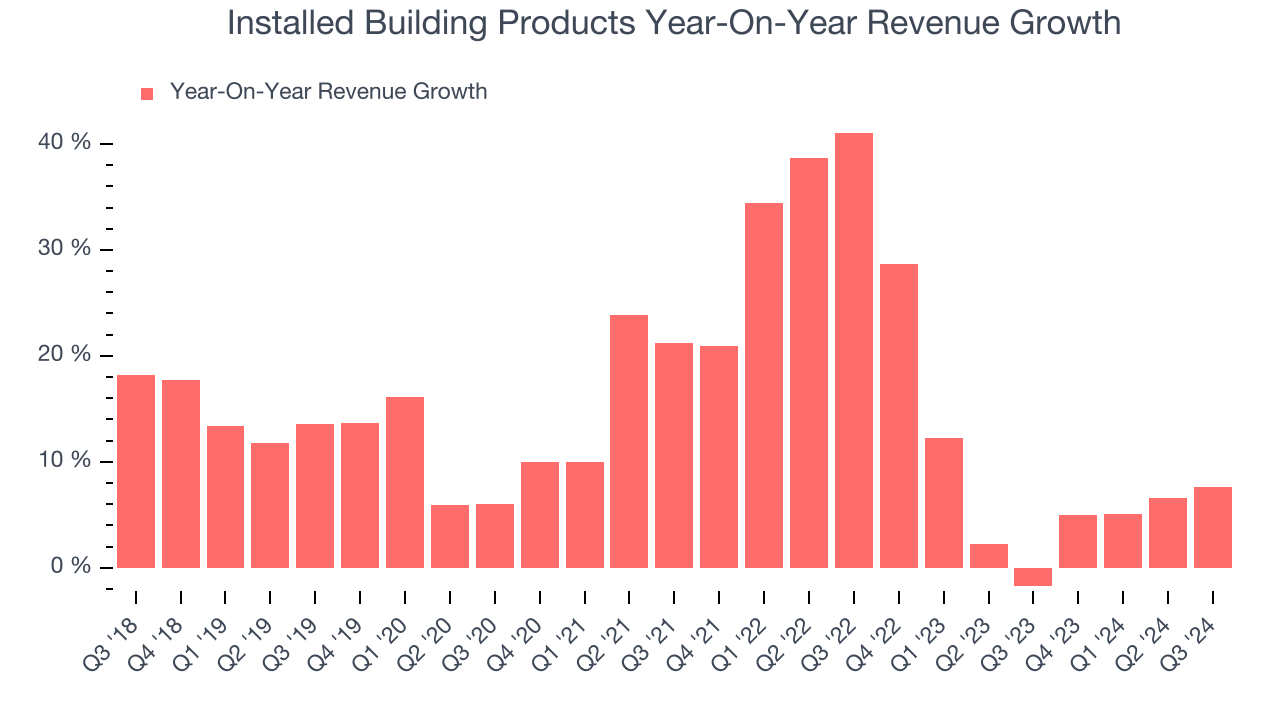
This quarter, Installed Building Products grew its revenue by 7.7% year on year, and its $760.6 million of revenue was in line with Wall Street’s estimates.
Looking ahead, sell-side analysts expect revenue to grow 6.1% over the next 12 months, a slight deceleration versus the last two years. This projection is underwhelming and indicates the market believes its products and services will see some demand headwinds. At least the company is tracking well in other measures of financial health.
When a company has more cash than it knows what to do with, buying back its own shares can make a lot of sense–as long as the price is right. Luckily, we’ve found one, a low-priced stock that is gushing free cash flow AND buying back shares. Click here to claim your Special Free Report on a fallen angel growth story that is already recovering from a setback.
Operating Margin
Installed Building Products has been an optimally-run company over the last five years. It was one of the more profitable businesses in the industrials sector, boasting an average operating margin of 11.9%.
Looking at the trend in its profitability, Installed Building Products’s annual operating margin rose by 3.7 percentage points over the last five years, as its sales growth gave it operating leverage.
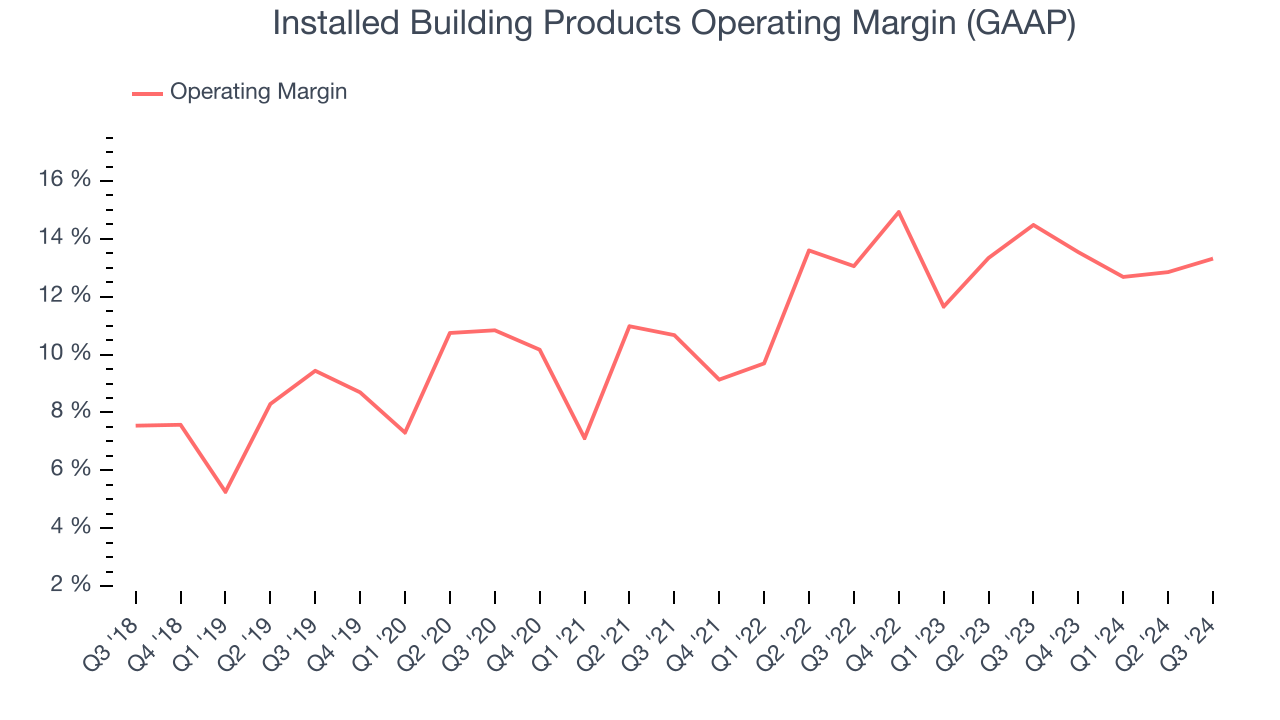
In Q3, Installed Building Products generated an operating profit margin of 13.3%, down 1.2 percentage points year on year. Since Installed Building Products’s operating margin decreased more than its gross margin, we can assume it was recently less efficient because expenses such as marketing, R&D, and administrative overhead increased.
Earnings Per Share
We track the long-term change in earnings per share (EPS) for the same reason as long-term revenue growth. Compared to revenue, however, EPS highlights whether a company’s growth was profitable.
Installed Building Products’s EPS grew at an astounding 28.6% compounded annual growth rate over the last five years, higher than its 14.7% annualized revenue growth. This tells us the company became more profitable as it expanded.
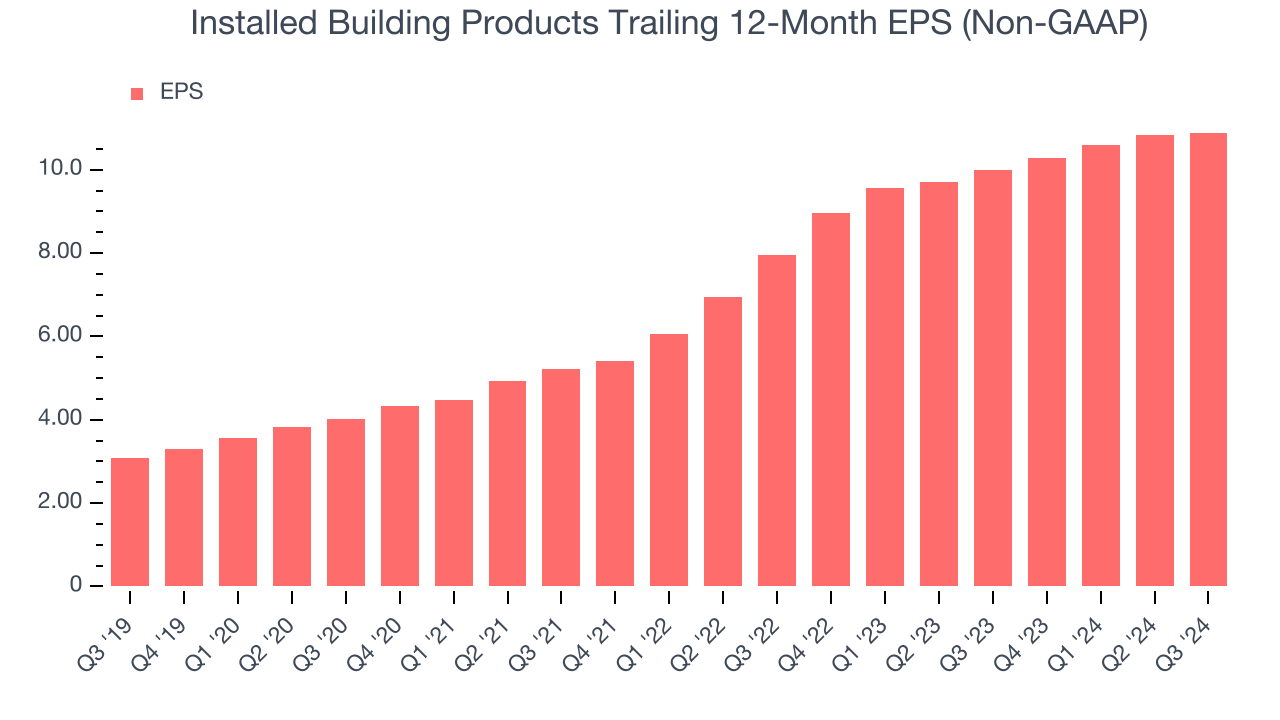
Diving into Installed Building Products’s quality of earnings can give us a better understanding of its performance. As we mentioned earlier, Installed Building Products’s operating margin declined this quarter but expanded by 3.7 percentage points over the last five years. Its share count also shrank by 5.9%, and these factors together are positive signs for shareholders because improving profitability and share buybacks turbocharge EPS growth relative to revenue growth. 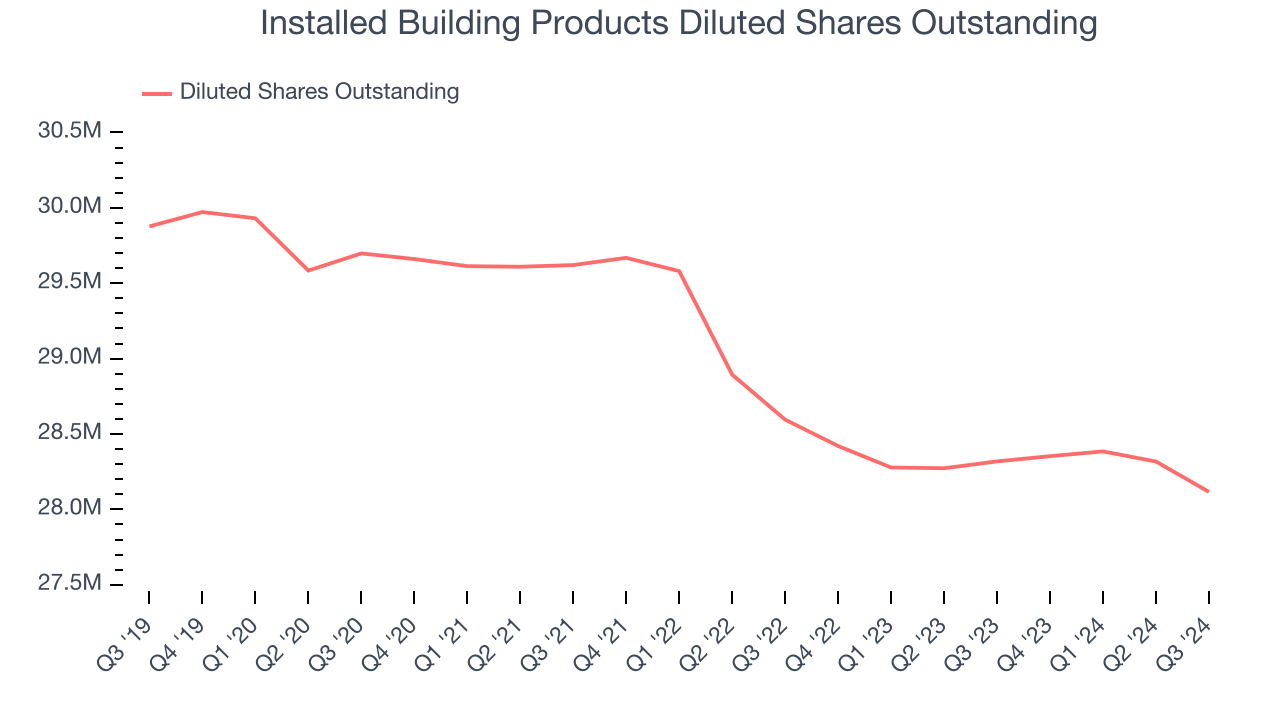
Like with revenue, we analyze EPS over a shorter period to see if we are missing a change in the business.
For Installed Building Products, its two-year annual EPS growth of 17% was lower than its five-year trend. We still think its growth was good and hope it can accelerate in the future.In Q3, Installed Building Products reported EPS at $2.85, up from $2.79 in the same quarter last year. Despite growing year on year, this print missed analysts’ estimates, but we care more about long-term EPS growth than short-term movements. Over the next 12 months, Wall Street expects Installed Building Products’s full-year EPS of $10.89 to grow by 7.7%.
Key Takeaways from Installed Building Products’s Q3 Results
It was good to see Installed Building Products beat analysts’ revenue expectations this quarter. On the other hand, its EPS missed and its EBITDA fell short of Wall Street’s estimates. Overall, this was a softer quarter. The stock traded down 4.4% to $217.44 immediately following the results.
Installed Building Products didn’t show it’s best hand this quarter, but does that create an opportunity to buy the stock right now? We think that the latest quarter is only one piece of the longer-term business quality puzzle. Quality, when combined with valuation, can help determine if the stock is a buy. We cover that in our actionable full research report which you can read here, it’s free.


