
Aerospace and defense company HEICO (NSYE:HEI) fell short of the market’s revenue expectations in Q3 CY2024, but sales rose 8.2% year on year to $1.01 billion. Its GAAP profit of $0.99 per share was 1.3% above analysts’ consensus estimates.
Is now the time to buy HEICO? Find out by accessing our full research report, it’s free.
HEICO (HEI) Q3 CY2024 Highlights:
- Revenue: $1.01 billion vs analyst estimates of $1.03 billion (8.2% year-on-year growth, 1.7% miss)
- Adjusted EPS: $0.99 vs analyst estimates of $0.98 (1.3% beat)
- Adjusted EBITDA: $263.3 million vs analyst estimates of $272.8 million (26% margin, 3.5% miss)
- Operating Margin: 21.6%, up from 20.2% in the same quarter last year
- Free Cash Flow Margin: 20.3%, up from 14.2% in the same quarter last year
- Market Capitalization: $31.2 billion
Company Overview
Founded in 1957, HEICO (NYSE:HEI) manufactures and services aerospace and electronic components for commercial aviation, defense, space, and other industries.
Aerospace
Aerospace companies often possess technical expertise and have made significant capital investments to produce complex products. It is an industry where innovation is important, and lately, emissions and automation are in focus, so companies that boast advances in these areas can take market share. On the other hand, demand for aerospace products can ebb and flow with economic cycles and geopolitical tensions, which can be particularly painful for companies with high fixed costs.
Sales Growth
Reviewing a company’s long-term sales performance reveals insights into its quality. Any business can have short-term success, but a top-tier one grows for years. Thankfully, HEICO’s 13.4% annualized revenue growth over the last five years was excellent. Its growth surpassed the average industrials company and shows its offerings resonate with customers, a great starting point for our analysis.
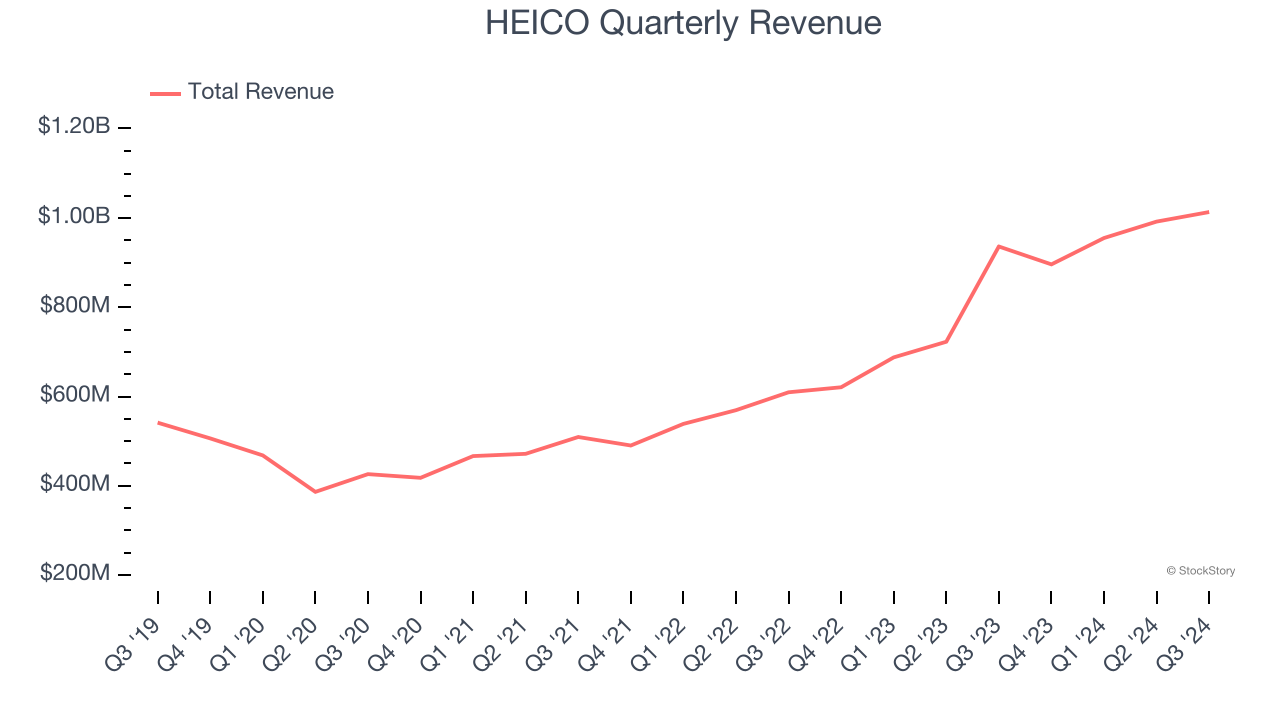
We at StockStory place the most emphasis on long-term growth, but within industrials, a half-decade historical view may miss cycles, industry trends, or a company capitalizing on catalysts such as a new contract win or a successful product line. HEICO’s annualized revenue growth of 32.2% over the last two years is above its five-year trend, suggesting its demand was strong and recently accelerated. 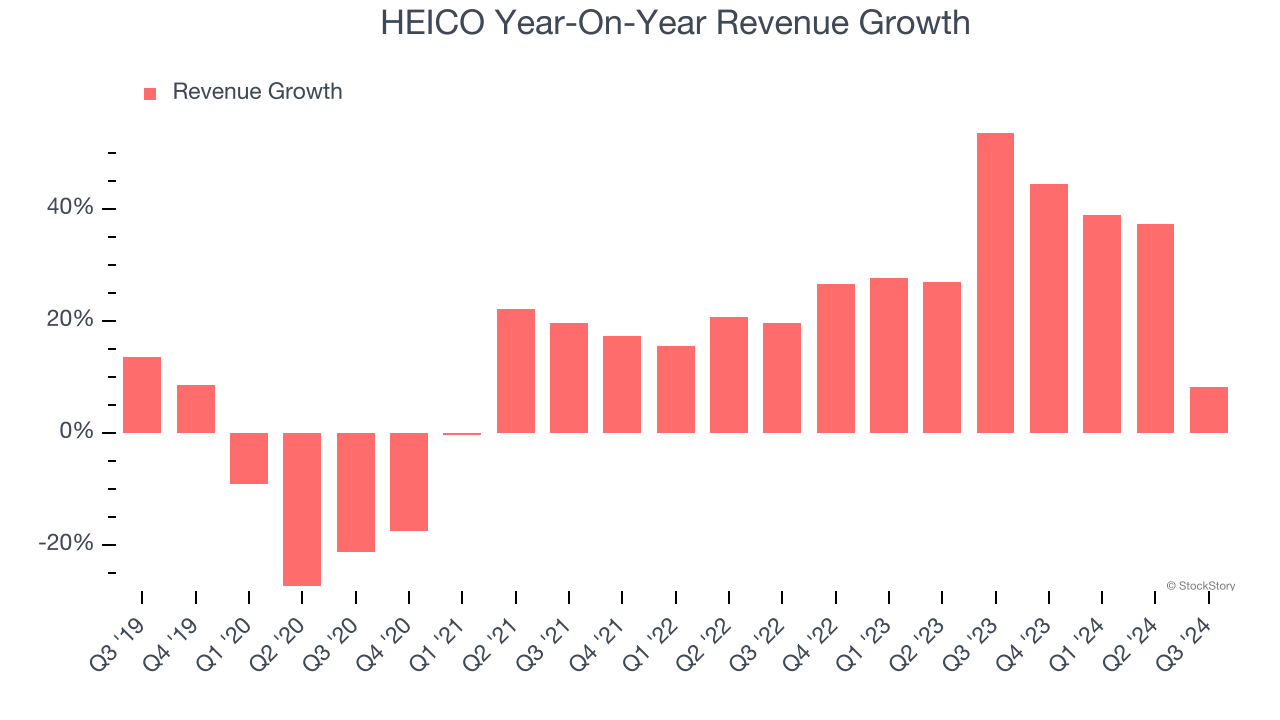
This quarter, HEICO’s revenue grew by 8.2% year on year to $1.01 billion, missing Wall Street’s estimates.
Looking ahead, sell-side analysts expect revenue to grow 10.9% over the next 12 months, a deceleration versus the last two years. Still, this projection is healthy and implies the market sees success for its products and services.
Here at StockStory, we certainly understand the potential of thematic investing. Diverse winners from Microsoft (MSFT) to Alphabet (GOOG), Coca-Cola (KO) to Monster Beverage (MNST) could all have been identified as promising growth stories with a megatrend driving the growth. So, in that spirit, we’ve identified a relatively under-the-radar profitable growth stock benefiting from the rise of AI, available to you FREE via this link.
Operating Margin
HEICO has been a well-oiled machine over the last five years. It demonstrated elite profitability for an industrials business, boasting an average operating margin of 21.4%.
Analyzing the trend in its profitability, HEICO’s operating margin might have seen some fluctuations but has generally stayed the same over the last five years, highlighting the long-term consistency of its business.
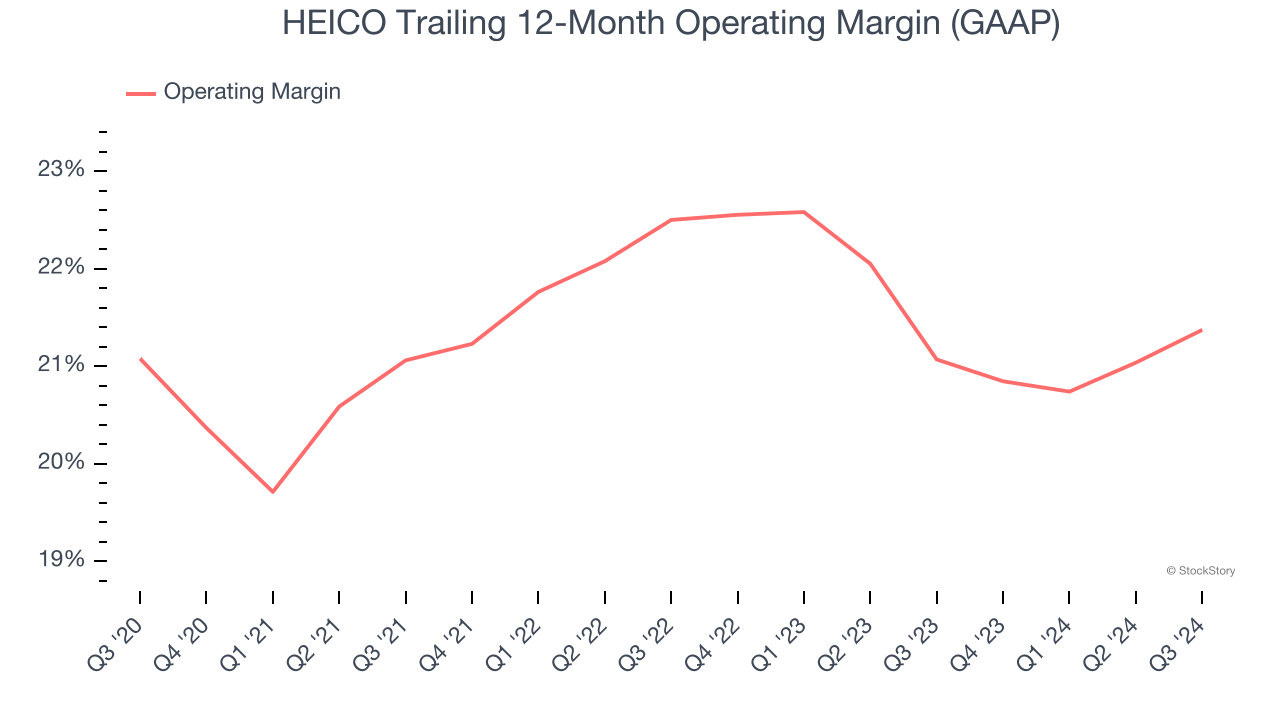
This quarter, HEICO generated an operating profit margin of 21.6%, up 1.3 percentage points year on year. This increase was a welcome development and shows it was recently more efficient because its expenses grew slower than its revenue.
Earnings Per Share
Revenue trends explain a company’s historical growth, but the long-term change in earnings per share (EPS) points to the profitability of that growth – for example, a company could inflate its sales through excessive spending on advertising and promotions.
HEICO’s EPS grew at a decent 8.9% compounded annual growth rate over the last five years. However, this performance was lower than its 13.4% annualized revenue growth, telling us the company became less profitable on a per-share basis as it expanded.
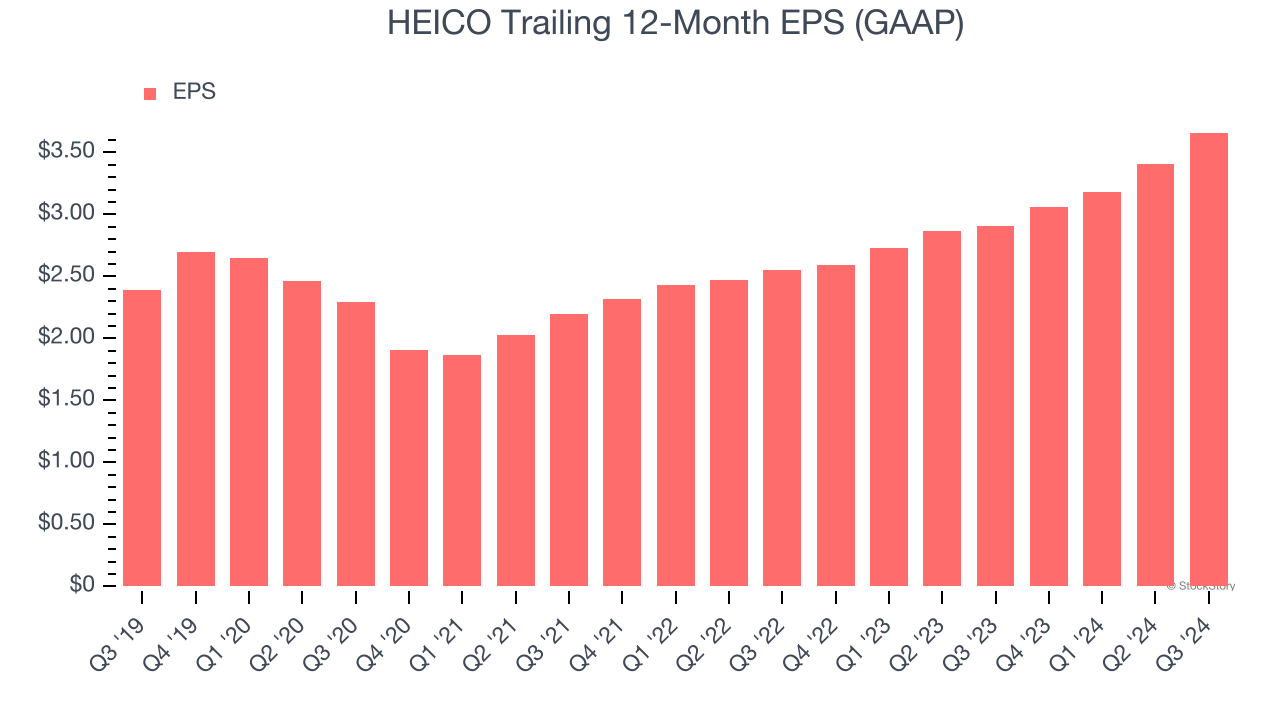
Diving into HEICO’s quality of earnings can give us a better understanding of its performance. A five-year view shows HEICO has diluted its shareholders, growing its share count by 2.1%. This has led to lower per share earnings. Taxes and interest expenses can also affect EPS but don’t tell us as much about a company’s fundamentals. 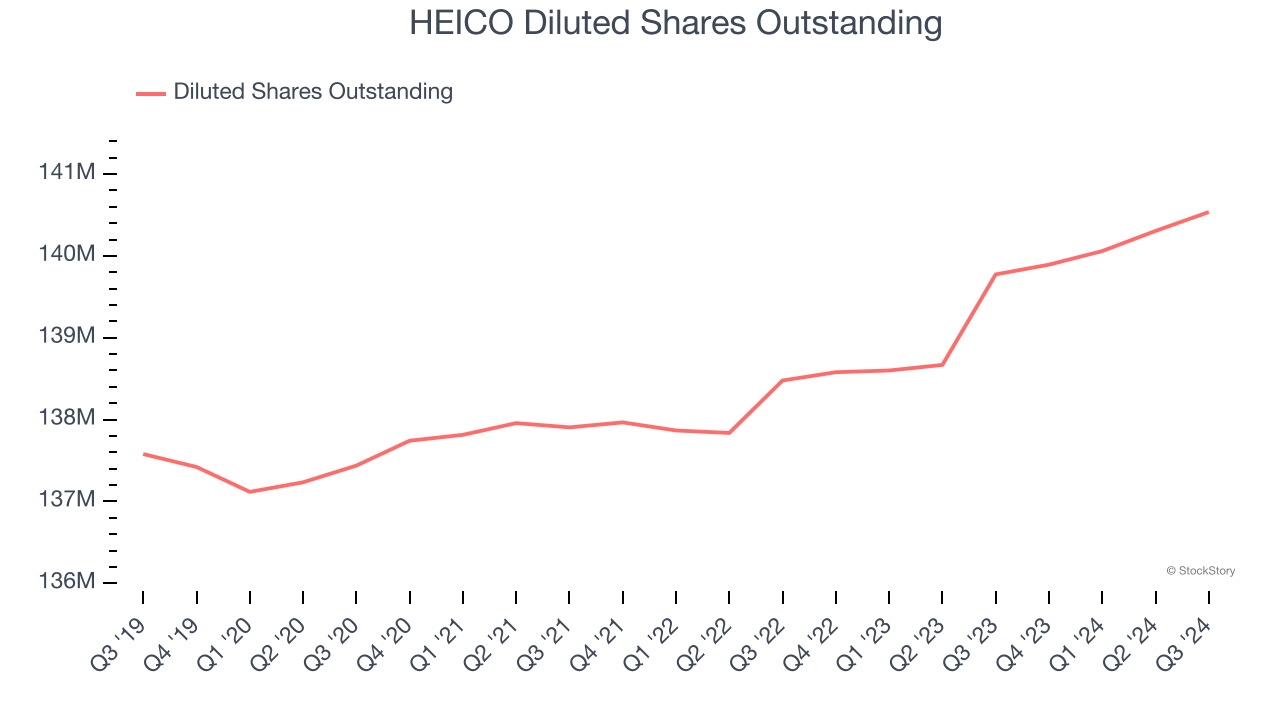
Like with revenue, we analyze EPS over a shorter period to see if we are missing a change in the business.
For HEICO, its two-year annual EPS growth of 19.8% was higher than its five-year trend. This acceleration made it one of the faster-growing industrials companies in recent history.In Q3, HEICO reported EPS at $0.99, up from $0.74 in the same quarter last year. This print beat analysts’ estimates by 1.3%. Over the next 12 months, Wall Street expects HEICO’s full-year EPS of $3.66 to grow 17.9%.
Key Takeaways from HEICO’s Q3 Results
We struggled to find many resounding positives in these results. Its revenue missed and its adjusted operating income fell short of Wall Street’s estimates. Overall, this was a weaker quarter. The stock traded down 5% to $246.90 immediately following the results.
HEICO’s latest earnings report disappointed. One quarter doesn’t define a company’s quality, so let’s explore whether the stock is a buy at the current price. When making that decision, it’s important to consider its valuation, business qualities, as well as what has happened in the latest quarter. We cover that in our actionable full research report which you can read here, it’s free.


