Investors have long appreciated the relationship that when rates go up...stocks go down.
That was a prime catalyst behind the 2022 bear market. Yet investors were encouraged in 2023 that inflation was coming under control...and thus rates would head lower in the future. This had stocks back on the rise for the majority of the year.
Then on 9/20 the Fed said “NOT SO FAST!” which had rates spiking again...and investors fleeing stocks.
Did that story take a turn for the better on Thursday?
Let’s review in this week’s commentary.
Market Commentary
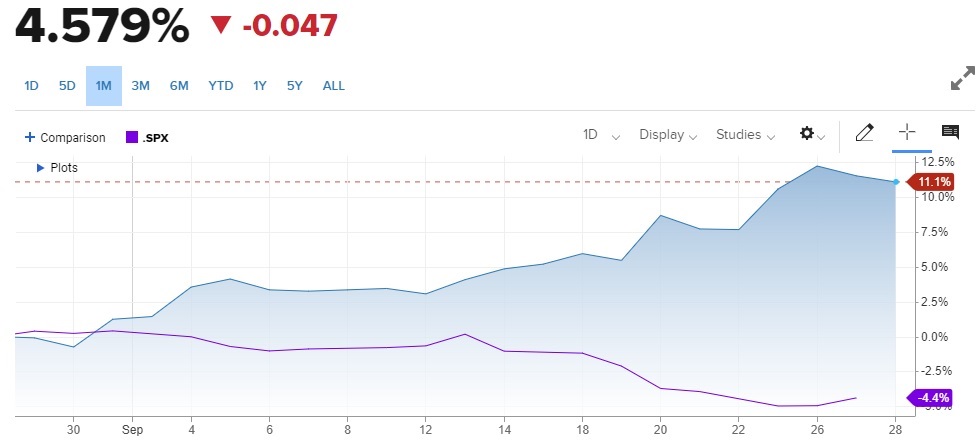
The best place to start our conversation is with this 1 month chart showing the rise of the 10 Year Treasury rate vs. the decline of the S&P 500 (SPY):

The inverse relationship is quite apparent. As rates accelerated higher later in the month...the stock decline accelerated as well.
The reasons behind the higher rates was explained in detail in my commentary after the 9/20 Fed announcement. Here is the core section for our discussion today:
“...Nutshell of the Wednesday Fed announcement.
The economy is doing better than we expected...so it’s going to take a bit longer to bring down inflation to target level...the good news is that we really believe we can do it without creating a recession.
So why did stocks go down on this seemingly positive outlook?
Because the dot plot of rate expectations by Fed officials now has the end of 2024 rate still way up at 5.1%. That was revised higher from the previous estimate of 4.6%.
Yes, this most certainly fits in with the Fed narrative of “higher rates for longer”, but much longer and higher than investors previously anticipated.”
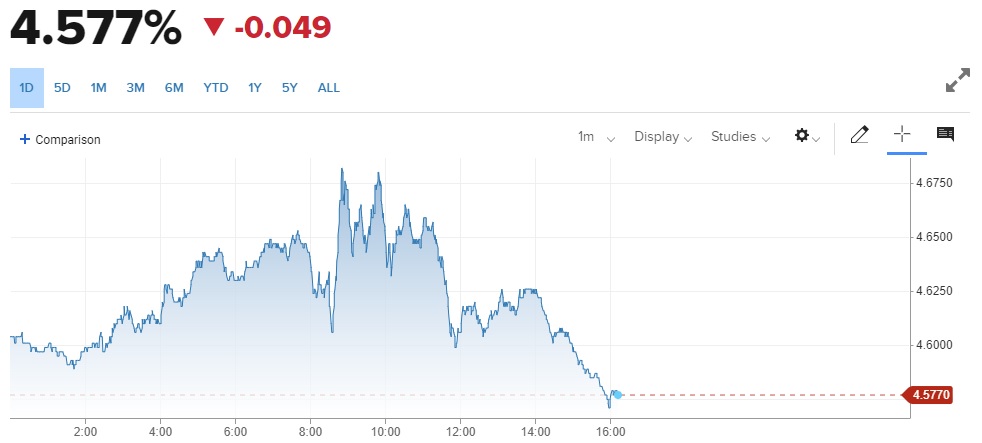
Now let’s narrow in on what happened with 10 year Treasury rates on Thursday:

This one day chart shows how rates continued to spike early in the session Thursday up towards a high of 4.688%. Yet dramatically reversed course ending the session down at 4.577%. That also helped stocks enjoy one of their best sessions in a while. (The bond sell off extended into Friday which increases the odds we have seen peak rates).
Please remember that rates were down around 3.8% just a couple months ago. This is a dramatic move that may have finally run its course. If so, then it helps improve the odds that we have made a bottom with stocks moving higher from here.
The biggest surprise I see with the recent rise in bond rates is how the likelihood of a rate hike at the November 1st Fed meeting has dropped from 62% just a month ago to only 19% as of today. Further the idea of a raise happening by the December 13th meeting has declined to 36%.
This information just doesn’t jive with Fed statements in September which seemed to indicate strong likelihood of at least one more hike. Nor does it jive with soaring bond rates. Again, perhaps another clue that the rally in bond rates is overextended and ready to retreat which is good for stocks.
Pulling back to the big picture it is very hard to have a bear market without a recession forming. And right now the odds of that are fairly low.
That is why I believe that this sell off is finding a bottom around current levels. And perhaps no further than the 200 day moving average closing in on 4,200. That is the downside possibility.
Whereas the upside potential this year has us retesting the highs of 4,600 seen in late July. And then next year likely cracking above 5,000.
Thus, I recommend staying fully invested in this market. The key to success is picking the best investments. And that is what we will cover in the next section...
What To Do Next?
Discover my brand new “2024 Stock Market Outlook” covering:
- Bear Case vs. Bull Case
- Trading Plan to Outperform
- Top 11 Picks for the Year Ahead
- And Much More!
Gain access to this vital presentation now by clicking below:
Wishing you a world of investment success!

Steve Reitmeister…but everyone calls me Reity (pronounced “Righty”)
CEO, StockNews.com and Editor, Reitmeister Total Return
SPY shares were trading at $430.78 per share on Friday morning, up $2.26 (+0.53%). Year-to-date, SPY has gained 13.89%, versus a % rise in the benchmark S&P 500 index during the same period.
About the Author: Steve Reitmeister

Steve is better known to the StockNews audience as “Reity”. Not only is he the CEO of the firm, but he also shares his 40 years of investment experience in the Reitmeister Total Return portfolio. Learn more about Reity’s background, along with links to his most recent articles and stock picks.
The post Stock Market vs. Bond Rate Relationship Revealed appeared first on StockNews.com


